PoD: analysis of pooled samples for dominant diseases
About this program
This program was designed to analyse SNP data from a pedigree which contains a dominant
disease gene, using pooled DNA. One pool contains DNA from affected individuals while the other has only unaffected DNA.
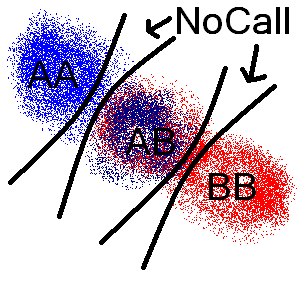
The algorithm looks for differences between the two data files and scores them such that if one file contains a SNP
genotype of AA while the other file is BB, then is scores more than one file been homozygous and the other heterozygous.
Similarly a difference of a called genotype compared to and a 'Nocall' scores the least. The image below shows the general
scoring scheme with the score increasing for each black line dividing the path between genotypes from each file.
The program then scans the chromosomes with a sliding window and adds up the total score across the window. This score
is then graphed and any region that may be linked to the disease allele should show a peak in the graph.

However, it does not seem to work and is placed here to warn off people trying to map dominant diseases
with pooled SNP data.
Pooled data versus non-pooled data
My experience with this program suggests that it's a bad idea to pool samples from dominant families. However people in my
department have successfully used pooled samples from pedigrees with recessive disease genes. They analysed their data with
IBDfinder and/or AutoSNPa. Generally, I suggest not using pooled samples, but if you have lots of families and no money it
may be a good way to get to a gene, but be very, very careful about the phenotype of the patients if they come from different pedigrees.
If I have not put you off and you want to take this forward you can always contact me if you have an idea about the analysis algorithm.
Meanwhile the program can be downloaded below.
 This program can be downloaded
here. This program can be downloaded
here.
Computer requirements
This program runs on Microsoft Windows, using the .NET 2.0 environment which can be obtained from
here.
|