dbQC: ABI sequence quality tracking system.
Overview
With the advent
of high through put Sanger sequencing technologies the elucidation a DNA
sequence has become a trivial exercise to the point where in many institutes,
sequencing has become a core service. However, this separation of labour has
made it harder to track the cause of poor sequence data, since the bench
researchers will know nothing of the events with in the sequencing service,
while the service providers will know little about the template quality they
are working with. To overcome this problem we developed dbQC to track the
changes in sequence quality Phred scores over time with respect the DNA source,
machine operator, individual machine or a specific capillary. Phred scores are
created by the ABI base calling software, which needs to be configured to save
this data in the form of *.phd.1 files. By following the trends in sequence
quality it is possible to identify:
- The point at
which the capillaries need to be changed
- ‘Operators’ that
need further training.
- ‘Users’ who consistently
send samples that generate low quality sequences.
Program requirements
The program has
no minimum requirements other than the presence of the .NET framework version
2.0, which can be obtained free of charge from Microsoft.com (
http://www.microsoft.com/downloads/details.aspx?FamilyID=0856EACB-4362-4B0D-8EDD-AAB15C5E04F5&displaylang=en).
The sequence quality data is stored in a password protected Microsoft Access
data file. However, MS Access is NOT required by this program.
Terms used in this walkthrough
When entering
quality scores into the database it is necessary to link the scores to certain
parameters used in its production. These have been termed ‘User’, ‘Operator’, ‘Machine’
and ‘Well’. While the latter two terms are strongly linked a physical object,
the first two phrases may be used to describe a number of different entities
that depend on the environment in which the program is used. ‘User’ can be used
to describe the origin of the DNA temple, which could be an individual, a
research group, a project or a specific method of DNA extraction or
purification. Like wise, the term ‘Operator’ can refer to a person who operated
the sequencing machine, performed the sequencing reactions or different service
providers. Clearly the use of these terms is variable, but for the purpose of
this document ‘User’ and ‘Operator’ will refer to individuals that send a DNA
template to the operator that performs the sequencing reactions and then loads
them on to the sequencing machine.
Analysis settings
The program
calculates the highest average Phred score over a long and short length of DNA
in each trace file. This score is not set to a specific sequence, but is the
highest average Phred score of that length any way in the trace file. To pass,
a sequence must have an average score of more than 40, e.g. if the highest
scores are 41 over 150bp and 39 over 300bp the sequence is said to have passed
at 150bp, failed at 300bp. Since only the sequence quality scores are
maintained in the database these values can not be changed once the database
contains data, therefore it is only possible to adjust these values when working
with an empty data file (see ‘Adjusting the analysis settings’).
Using the program
Starting the program
When the program runs for the first
time, it looks for the dbQC.mdb database file in the same folder as the
program. If it does not find the file it will then prompt you to select the database
file. The database file can be located on the current machine or on a network
share, in which case multiple people can view the data. Once, it has been
linked to a file it will look for this file each time it is run. If you have
more than one database file it is possible to change between the different
files using the ‘Admin’ > ‘Change database’ menu option (Figure 1).
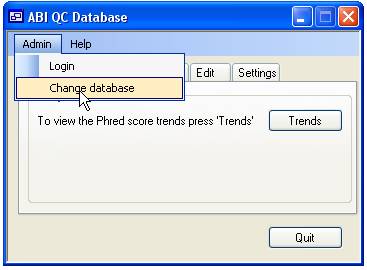
Figure 1
The program’s
interface contains five ‘tabs’ which expose different types of task. The
commonest tasks are shown first, however to use the program the database must
be set up correctly, therefore the walkthrough will describe these tabs in
reverse order. To edit the database, you must logon as an Administrator via the
‘Admin’ > ‘Login’ menu
Adjusting the analysis settings
Since only the
calculated quality score data is stored in the database changes in these
settings can not be made retrospectively. Therefore to prevent stored data calculated
with different analysis criteria, these setting can only be changed in an empty
database. To change the settings select the ‘Settings’ tab (Figure 2).
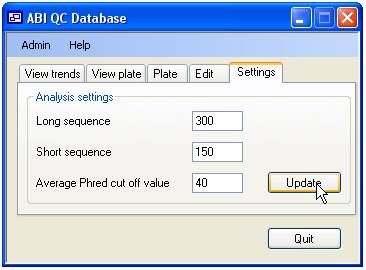
Figure 2
The length of
the short and long sequences over which the average Phred score is calculated
is set using the upper two input boxes, while the Average Phred cut off value
is set via the lower text box. The permitted values are shown in table 1. If
you enter incorrect values the ‘Update’ button will be disabled and the label
next to the erroneous value will be written in red.
|
Setting
|
Minimum value
|
Maximum value
|
|
Long sequence
|
100bp
|
1000bb
|
|
Short sequence
|
50bp
|
800bp
|
|
Average Phred cut
off value
|
20
|
100
|
Table 1
Adding and editing ‘Users’, ‘Operators’ and ‘Machines’
To add a ‘User’,
‘Operator’ or a sequencing ‘Machine’ to the database select the ‘Edit’ tab
(figure 3) and press the ‘User’ button to add either ‘Users’ or ‘Operators’ similarly
press the ‘Machine’ button to add an ABI sequencing ‘Machines’. Since the
program is designed to show trends in data, it is not possible to delete a person
or machine from the database. Instead ‘Users’ should be set as ‘Not current,
and ‘Machines’ set as ‘Not in use’.
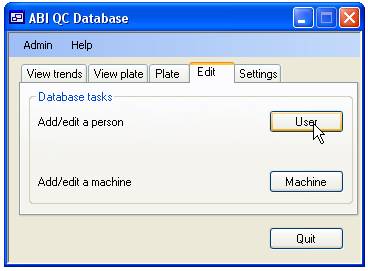
Figure 3
Adding and updating ‘Users’ or ‘Operators’
As stated
earlier the exact meaning of ‘User’ and ‘Operator’ may vary depending on the
environment in which you work. However, the program assumes both to be people
and so ‘Users’ and ‘Operators’ are added via the same form (Figure 4).
The database
comes with two predefined ‘Users’ called ‘Admin’ and ‘Not set’. The Admin
(password admin) object is used to log on to the system when setting up the database
and should be renamed (with a new password) if the database is to be shared
among multiple uses. The ‘Not set’ ‘User’ can not be changed and is used by the
program as a default ‘User’ to link to wells not linked to a specific ‘User’
(see ‘Adding Phred score data’ below).
The form is
composed of two panels; the upper ‘User’ panel is used to select the person,
while the lower ‘Editing User’ panel is used to edit the person’s settings. To
edit an existing person select their name from the drop down list and change
their details in the lower panel. Similarly to add a new person, press the ‘New’
button to the right of the drop down list and enter their details in the lower
panel. An explanation of these settings is given in table 2. Finally to save
the changes to the database press the ‘Submit’ button.
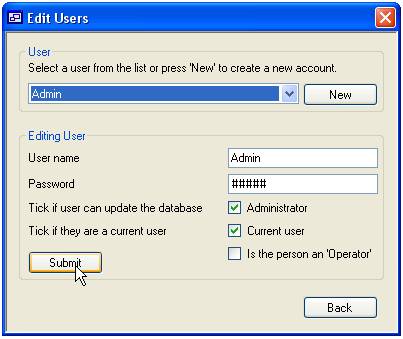
Figure 4
|
User name
|
This is the name
used to identify the person while using the database. It must be between 4
and 50 characters (including spaces)
|
|
Password
|
This is the
password used by Administrators to login. It should be between 4 and 14
characters. (All ‘Users’ have passwords).
|
|
Administrator
|
If checked it
allows the person to edit the database (i.e. add people, machines and plate
data) otherwise the person can only see the trends.
|
|
Current user
|
It is only possible
to link current ‘Users’ and ‘Operators’ to plate date.
|
|
Is the person an
‘Operator’
|
Only people marked
as operators can be selected as running a machine/plate.
|
Table 2
Adding and updating ‘Machines’
The process of
adding ABI sequencing machines is very similar to adding ‘Users’. To edit an
existing machine select its name from the list in the upper ‘Machine’ panel
while to add a new ‘Machine’ press the ‘New’ button, then edit the data in the
lower ‘Editing machine’ panel. The machine name must be between 4 and 20
characters and is used to identify the machine when adding or viewing data. The
number of capillaries is set by selecting a value from the list below the
machine name text box. Finally, checking the ‘In use’ options allows the
machine to be linked to new plate data.
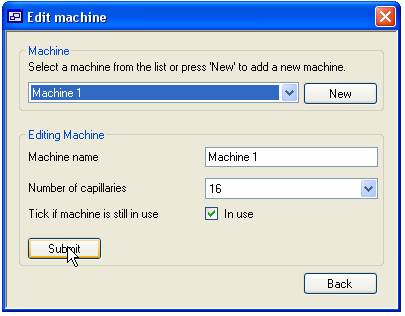
Figure 5
Adding and deleting sequence quality score data
Since sequencing
is performed on a per plate basis the addition and deletion of quality scores
is also done per plate. Adding and deleting data is done via the ‘Plate’ tab
(figure 6)
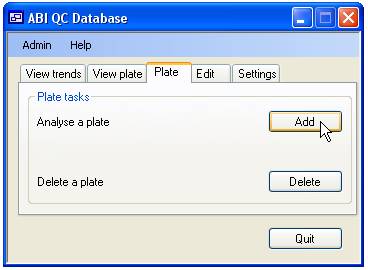
Figure 6
Adding Phred score data
To add Phred
score for a sequencing plate press the ‘Add’ button on the ‘Plate’ tab to
access the ‘Plate setup’ form (figure 7). This form is divided in to three
panels the ‘Plate setup’ panel, the ‘Plate details’ panel and the ‘Phred files (*.phd.1)”
panel. The ‘Setup panel’ enables you to select the ‘Machine’ and ‘Operator’
that processed the sequence reactions and the day on which it was done. The
‘Plate details’ panels allows you to enter a name for the plate and link each
sequence reaction on the plate to a specific ‘User’. Pressing the ‘Generic’ button
links all the plate’s wells to the default ‘Not set’ user, while pressing the
‘User defined’ button allows you to link each well to a specific ‘User’ as
described below. Finally, pressing the ‘Select’ button in the ‘Phred files
(*.phd.1)’ panels prompts you to select the folder containing the Phred score
(*.phd.1) files. The program automatically links these files to the correct
well by searching for the wells coordinates in the file name. This function
requires the files to have the original names allocated to them by the analysis
software with the formats of ‘B01_******.phd.1’, ‘****_B01_***.phd.1’ or
‘********_B01.phd.1’.
Linking a well to specific ‘User’
Pressing the ‘User defined’ button on the ‘Plate details’ panel displays
the ‘Well set up’ form shown in figure 8. Each well in the plate is represented
by a square labelled with the wells coordinates. These squares are initially pink to
signify that the well is linked to the default ‘User’ (‘Not set’). To link a
well to a ‘User’ select their name in the list of ‘User’ names at the bottom
left corner of the form and click the appropriate square with the mouse, the
square should then become blue. To reset the well to the default ‘User’ select
‘Not set’ from the list and click the square again. It is possible to link
multiple wells with the same ‘User’ by holding down the ‘r’ or ‘c’ key and
clicking a square with the mouse. This function is shown in figure 9, if the
cursor is placed other well A01 and the mouse button pressed while the ‘r’ key
is pressed the squares in the red box will be linked to the selected ‘User’
while holding the ‘c’ key down will link the well in the blue box. Similarly,
if this is repeated with the cursor over well D06 the wells in the yellow (‘r’
key down) and green box (‘c’ key down) will be linked to the same ‘User’.
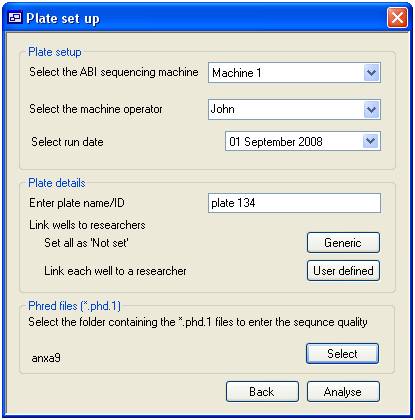
Figure 7
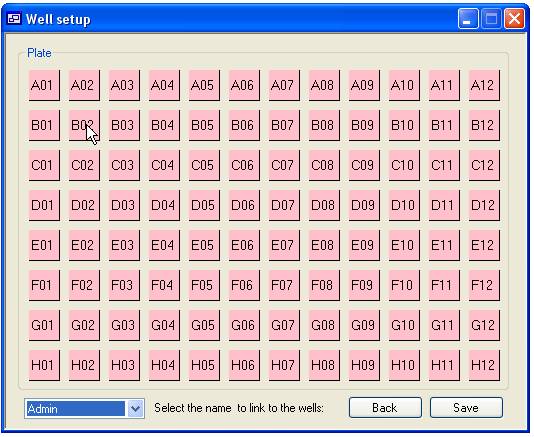
Figure 8
When you have finished linking the
wells to ‘User’ press the ‘Save’ button to update the data, however if you do
not want to save the changes, pressing the ‘Back’ button will discard the
changes. Finally to calculate and store the quality data press the ‘Analyse’
button on the ‘Plate setup’ form.
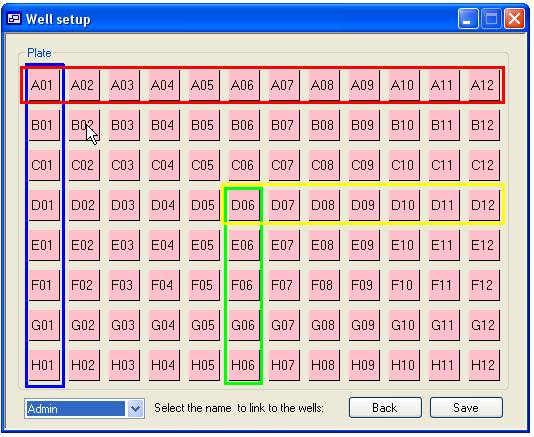
Figure 9
Deleting the quality scores for a plate
To delete a
plate press the ‘delete’ button on the ‘Plate’ tab (figure 6). This will
display the “Delete a plate” form which allows you to select a plate from all
those held in the system (figure 10). Initially, all the plates that where run
between 28 August 2008 and the present day are listed in the list box in the
lower ‘Select plate’ panel. It is possible to limit the plates shown in this
list by run date and/or plate name. Limiting the plates by date is done by
selecting the appropriate dates in the two calendar controls in the ‘Limit
search by…’ panel and then pressing the ‘Limit’ button. To limit by plate name
or partial name, enter the name in the text box below the calendar controls and
then press the ‘Limit’ button. This will limit the names in the plate list to
those that contain the text you have entered, irrespective of case. The list
can be limited by both text and date simultaneously.
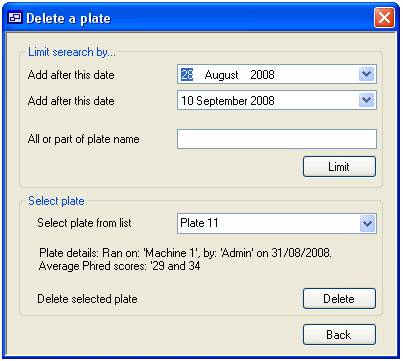
Figure 10
When a plate name is selected a
brief summary is displayed above the ‘Delete’ button. Finally, to delete a
plate press the ‘Delete’ button. Once the plate has been removed the date is
permanently lost.
Viewing a plates Quality scores
To view the
quality scores for a single plate, select the ‘View plate’ tab and press the
‘View’ button (figure 11). This will display the “Select a plate” form (figure
12) which is used in the same way as the ‘Delete a plate’ form described above.
Once you have selected a plate press the ‘View’ button. This displays the form
‘Plate data’ form, the data is arranged as a grid mirroring the wells in a
microtitre plate. If the average quality score for a well is higher than the
cut off the square is a blue colour, whereas those that failed are red (wells
H09 and H12 in figure 12). If a well is not linked to a Phred file the square
is white. The list box at the bottom left of the form allows you to alternate
between the quality scores for the long and short sequences.
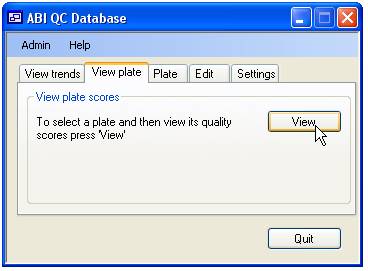
Figure 11
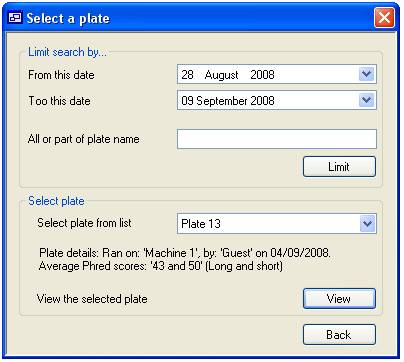
Figure 12
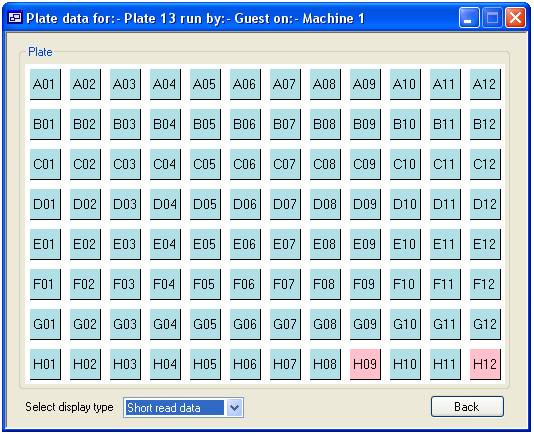
Figure 13
Viewing quality score trends
The quality
score data can be examined for long term trend or differences between, ‘Users’,
‘Operators’, machines or individual capillaries. The analysis criteria is
selected via the ‘Phred score trends’ form (figure 15) which is displayed by
pressing the ‘Trends’ button on the ‘View trends’ tab (figure 14).
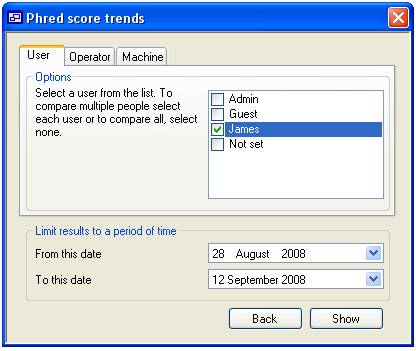
The ‘Phred score
trends’ form is composed of two panels the ‘Option’ panel and the lower ‘Limit
results to a period of time’. The lower panel allows you to limit the analysis
period, with the time window set using the two calendar controls. The upper
panel contains three tabs that allow you to sort the data by ‘User’, machine
‘Operator’ and machine (figures 15a, 15b and 15c respectively). Pressing the
‘Show’ button in the bottom right of the form extracts the data from the
database and displays it as a graph (Figure 16). To save the underlying data
press the ‘Save’ button on the ‘Graph’ form.
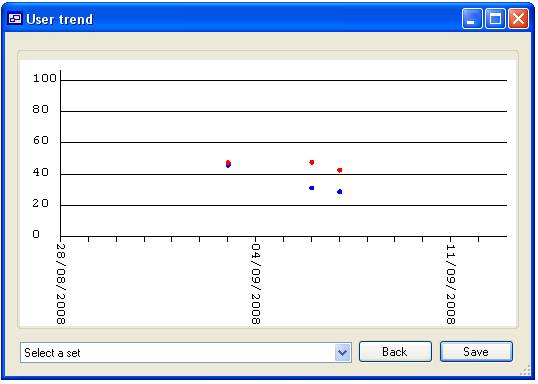
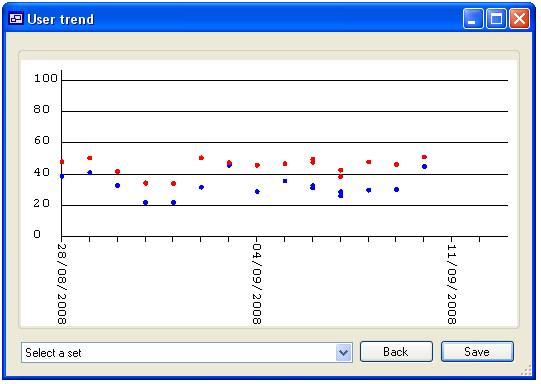
Each tab
contains a list of people or machines, only items ticked in this list are used
in the trend analysis unless no item is selected in which case all the items
are used. For instance in figure 15a the list contains the ‘User’ names ‘Admin’,
‘Guest’, ‘James’ and ‘Not set’ since only James is checked only data linked to
‘James’ would be displayed (figure 16a), however if none are selected then all
the ‘Users’ will be included in the analysis (figure 16b). When data for more
than one person is selected, each person’s data can be highlighted by selecting
their name from the list at the bottom left corner of the form (figure 16c).
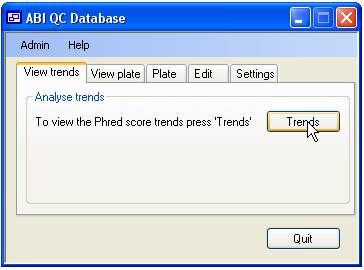
Figure 14
A
B
C
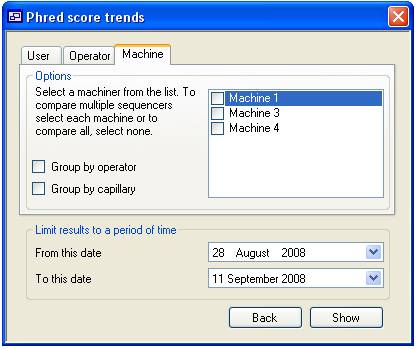
Figure 15
A
B
C
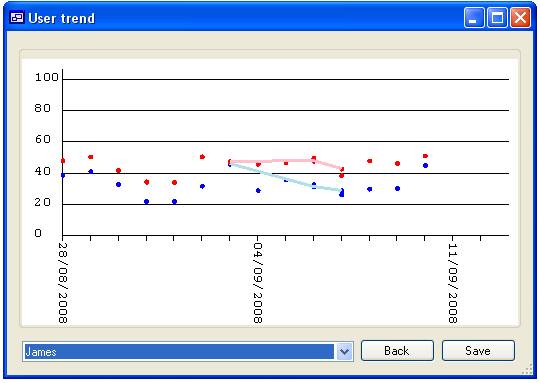
Figure 16
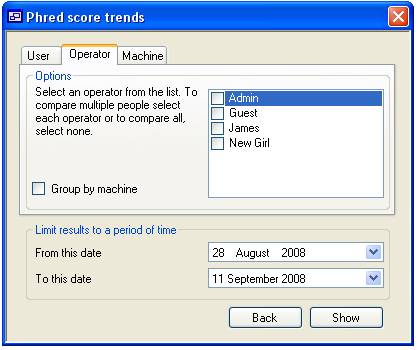
When viewing
Operator and Machine data it is possible subdivide the data where using the
check boxes to the left of the list of ‘Operators’ or ‘Machines’. When the
‘Group by machine’ option is checked on the ‘Operators’ tab it is possible to
view quality data for each ‘Operator’/’Machine’ combination that exists in the
database. Similarly, it is possible to sub divide the data in combinations of
‘Machine’, ‘Machine’/’Operator’, ‘Machine’/’Capillary’ and
‘Machine’/’Operator’/’Capillary’.
|